The PE-Backed CFO’s Complete Guide to Treasury Management

This article is written by our partner, Nilus

Treasury in a PE-backed company means staying liquid, meeting covenant limits, and defending your numbers to sponsors and lenders – under a capital structure with little room for error.

Treasury in a PE-backed company means staying liquid, meeting covenant limits, and defending your numbers to sponsors and lenders – under a capital structure with little room for error. For that to work, five workflows need to hold together: cash visibility, a 13-week forecast, covenant monitoring, reconciliation, and reporting. The problem is that most treasury setups don’t meet that standard.  If your cash view depends on pulling balances from bank portals and rebuilding your TWCF in Excel, you’re working off delayed information.  That works until a payment slips or a receipt lands later than expected – then the numbers stop tying, and you’re left explaining variances you can’t trace.

Why PE-backed company treasury management is different (the 5 structural pressures)

PE-backed treasury runs with leverage in the structure and weekly sponsor scrutiny. When something doesn’t tie out, it gets surfaced quickly – and you’re expected to have an answer. Here’s where that pressure shows up day to day.

1. Leverage changes every cash decision

In a leveraged business, treasury has to be operational. Every dollar you have either protects liquidity, pays down debt, or sits idle while you pay interest somewhere else. If one entity holds excess cash while another is borrowing to fund operations, you’re paying interest unnecessarily. If customer payments come in late by even two weeks, available liquidity tightens, and the impact moves straight into sponsor conversations. What matters is how much usable cash you have to service debt and run the business – by entity and by facility – based on who holds it and what your debt agreements allow you to move.

2. Reporting cadence shifts from monthly to weekly

You’re explaining cash movement continuously. That includes a weekly cash forecast, producing monthly sponsor or board reporting, and delivering quarterly lender reporting – while responding to ad hoc questions whenever results don’t match the plan. If a sponsor asks why week 4 cash collections came in below plan and what that means for your borrowing by month-end, you need an answer quickly. Answers that require manual data pulls or rework point to a broken process that can’t support the reporting cadence.

3. Covenant exposure creates hard thresholds

Covenant pressure doesn’t start when the certificate is due. It builds in the weeks leading up to it. The credit agreement sets EBITDA, not your internal model. If you’re using the wrong definition, you can misstate your covenant position. Add-backs, pro forma adjustments, and timing differences between activity and reporting can shift the outcome further. If you don’t see that early, you’re left reacting with limited options.

4. Multi-entity complexity compounds quickly

Cash can sit in one entity while another draws on the revolver – and you don’t see it until after the fact. That’s because the headline cash number hides how cash is distributed and what you can actually use. Access and movement vary by entity, so a consolidated balance doesn’t tell you whether cash offsets borrowing or supports operations where it’s needed. In a multi-entity setup, you need to see where cash sits, whether it’s accessible, and how it moves across the business – not just how much exists.

5. Accountability is personal

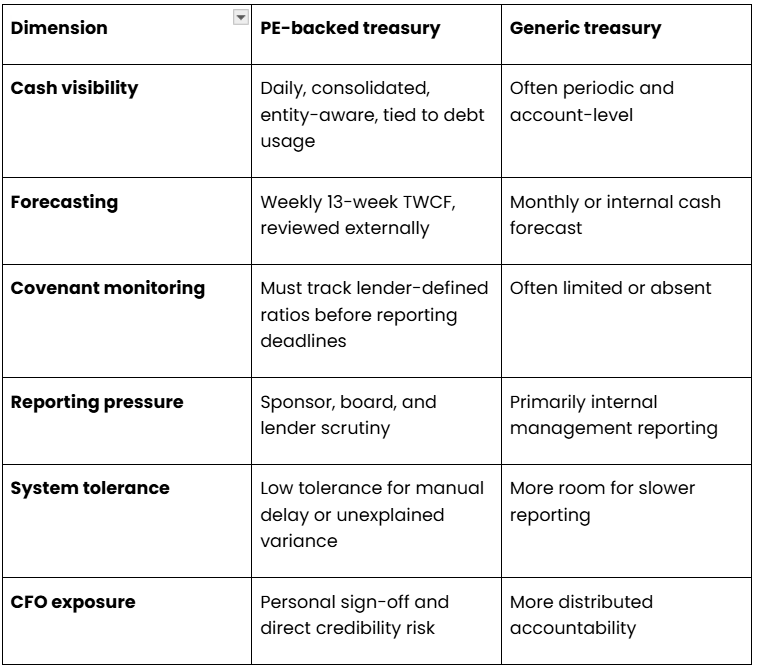
Treasury outcomes are attributed directly to you. You sign the compliance certificate. You stand behind the forecast. You explain what changed and why, and what happens next. If confidence in your cash reporting weakens, scrutiny increases across everything. This includes forecast assumptions, EBITDA adjustments, and variance explanations. That’s why many PE-backed finance teams move beyond spreadsheets to a more controlled setup. Not for better dashboards, but for a system where cash, forecasts, and covenant position stay aligned and don’t need to be rebuilt to explain changes. Below is a chart breaking down the differences between PE-backed treasury and generic treasury.__wf_reserved_inherit
The 5 pillars of PE treasury management

Treasury in a PE-backed company is driven by five core workflows. They are tightly linked – when one breaks, the impact carries through the rest. At Nilus, we’ve grouped these workflows into the 5 Pillars of PE Treasury Management – a framework you can use to optimize treasury management for PE portfolio companies.

Pillar 1: Real-time cash visibility

This is the starting point, because every other treasury decision depends on it. In a PE-backed company, the number that matters isn’t total cash. It’s usable cash by entity and account, within the constraints of your debt structure.  After an acquisition, that becomes harder to track. Now, cash sits across entities and accounts, some of it restricted, some already committed. At a group level, your cash position can look healthy while the part of the business under pressure has no access to it. The issue isn’t speed. It’s false confidence.  A manually consolidated cash report can tie out and still miss where liquidity is tightening, or where cash is sitting idle while debt remains drawn. That’s why same-day visibility needs to show a consolidated view across all entities and bank accounts, with enough detail to separate total cash from available cash and enough context to act on it.  If getting there still depends on pulling balances from multiple bank portals, that’s the first issue to fix.

Pillar 2: 13-week cash flow forecast (TWCF)

The 13-week cash flow forecast is where treasury gets tested. It shows whether you’re in control of short-term liquidity and helps sponsors and lenders understand whether pressure comes from timing, deterioration, or a real constraint. When a TWCF breaks, it’s usually because the assumptions don’t reflect how cash actually moves.  Collections are modeled on payment expected terms instead of observed behavior, and disbursements follow invoice dates rather than actual payment timing. Key outflows – like payroll, debt service, and taxes – are added too late. When actuals come in, they don’t tie back cleanly, so variance builds without a clear driver. The file gets produced, but nobody really trusts it. Each week, the forecast changes without becoming more reliable. A controlled TWCF is built around how cash behaves in practice.  Collections reflect real payment patterns, and disbursements align to actual timing. Fixed obligations are visible upfront, and one-off items are identified early enough to track. Actuals feed back into the model weekly so that any movement can be explained at the line level. This is also where time gets lost. If your TWCF takes hours each week to build, the process is too manual. Your team should focus on testing assumptions and deciding what moves, not rebuilding the file. The forecast should update as inputs change and clearly show what’s most likely to affect your cash position next.

Pillar 3: Covenant compliance monitoring

If covenant tracking happens as part of quarter-end reporting, you’re finding out your position at the same time you’re required to report it. By then, there’s little room to adjust – working capital and cost actions take time, and any conversation with lenders starts from a weaker position. You need visibility earlier, while the outcome can still change. That means tracking covenant positions continuously using lender-defined logic, not internal versions of EBITDA. The mechanics already exist in your credit agreement. The challenge is keeping those definitions inside your day-to-day model. When they sit outside it, covenant position gets calculated separately. And that’s where errors creep in. Headroom can look stable under internal assumptions, then tighten once lender-defined adjustments are applied. The change usually comes from timing, adjustments, and how the ratio is calculated. A controlled setup keeps covenant logic embedded in the same model as your cash and forecast. As inputs change, headroom updates with them, giving you a current view of where you stand and what’s driving it. At any point, you should be able to answer: Where do we stand today under lender definitions? What is most likely to move that position over the next few weeks? If those answers only come together when the certificate is due, you’ve already lost time to act.

Pillar 4: Bank reconciliation and close

Reconciliation ensures the numbers you use are accurate and reliable. When it runs late, close gets compressed, and reporting inherits the volatility. Unresolved items stay mixed into balances already used for cash updates, board reporting, and covenant support.  Most of this activity is routine – cash receipts, vendor payments, intercompany transfers – but when it isn’t cleared continuously, it piles up and gets pushed into the close window. That’s when timing differences, misapplied cash, and cutoff issues start to surface – right as reporting is being built. A controlled treasury process moves that work earlier. Routine activity is cleared as it comes in, and exceptions are identified with context while they’re still easy to resolve. By period-end, your team is working through a smaller set of items that actually require their judgment. Close then becomes a confirmation step, not a catch-up exercise – faster, with fewer late adjustments and less pressure on the reporting cycle.

Pillar 5: Sponsor and lender reporting

Reporting is where treasury gets exposed. You’re expected to move from a weekly cash update to a monthly package to a quarterly compliance certificate without changing the underlying story. The issue shows up when those outputs don’t align. When that happens, discussions shift away from liquidity and performance to how the numbers were defined and built. Follow-ups increase, timelines extend, and more time gets spent explaining how the numbers were built. The fix is a reporting process built on a single, governed data foundation, with each output pulling from the same logic. Weekly cash reporting, forecast updates, and covenant support should come from the same inputs and be reviewed in sequence. By the time numbers reach a sponsor or lender, they’ve already been used, tested, and explained internally. This keeps reporting from becoming a separate task each cycle and makes it part of the same process finance already runs.
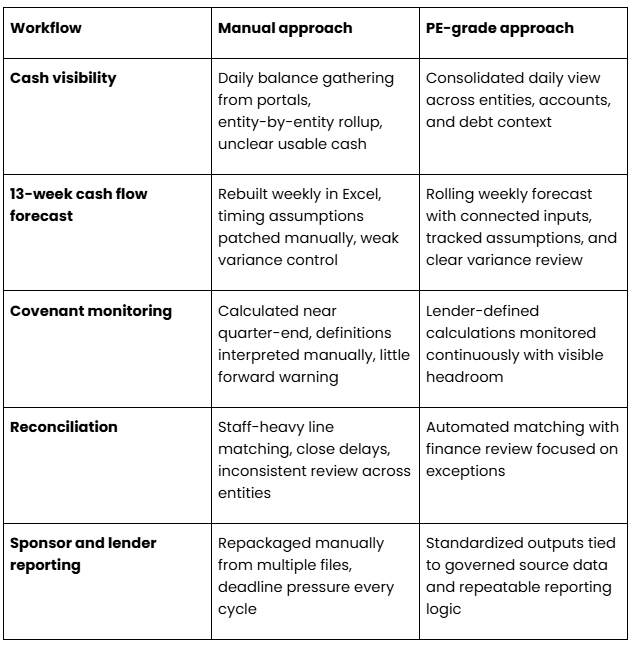
Manual vs. automated approach in a PE-backed treasury function

__wf_reserved_inherit

The PE Treasury Maturity Model

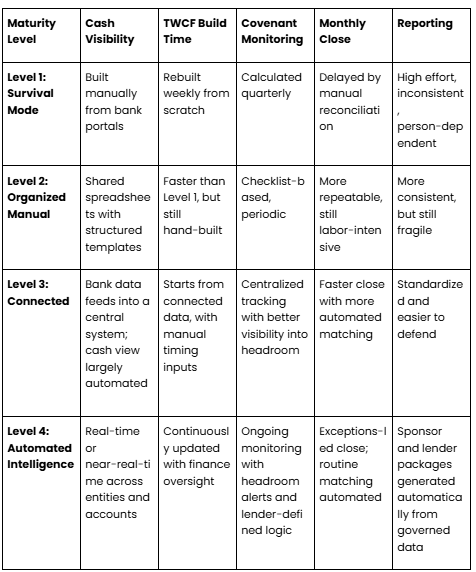
Treasury maturity improves as you reduce how much of the process still has to be rebuilt each cycle. Early on, you can still get the outputs you need – but it takes too much manual work to hold together. As the business grows, that approach breaks. This model shows how your setup evolves as those workflows become more connected and less dependent on rebuilds.
__wf_reserved_inherit

Level 1: Survival Mode

At Level 1, treasury exists – but only because you keep rebuilding it every cycle. Cash is pulled manually from bank portals. The TWCF is rebuilt weekly from prior versions. Covenant calculations happen near reporting deadlines. Reconciliation is slow. Close timing depends on how quickly manual issues are cleared In this setup, you can produce answers, though they take time and rely too much on manual work. As complexity increases through acquisitions, tighter liquidity cycles, or more detailed reporting, the process starts to break in visible ways.

Level 2: Organized Manual

At Level 2, you introduce structure, but the process still depends on manual work at critical points. Shared spreadsheets and standard templates exist for cash and TWCF. Reporting cadence is defined. Covenant tracking follows checklists. Reconciliation is more repeatable. That structure makes things feel more under control, especially since the process is no longer sitting in one person’s head. But the underlying dependencies haven’t changed. You still pull balances to build your cash view. Forecasts still take time to prepare. Covenant monitoring happens at intervals, not continuously. Reporting is more consistent, but producing it still takes significant effort. So the process works – until something changes.

Level 3: Connected control

At Level 3, treasury starts behaving like a real operating system instead of a workflow you rebuild. Bank data is connected into a central environment. ERP inputs feed key cash drivers. Cash visibility becomes consolidated, and daily TWCF starts from connected data, not manual builds. Covenant tracking becomes more centralised. Reconciliation relies more on matching logic and less on line-by-line handling. As a result, the function stops feeling fragile. You can answer same-day cash questions without delay, and weekly forecast prep shifts from assembling numbers to making decisions. The close starts to move with less friction. You’re not fully automated, but the system is stable enough to hold under PE reporting cadence.

Level 4: Automated intelligence

At Level 4, routine execution no longer depends on your team rebuilding the process each cycle. The system handles it, and your role shifts to control. TWCF updates from connected inputs and highlights movement. Covenant logic runs continuously under lender-defined calculations. Tightening headroom is flagged ahead of reporting cycles. Reconciliation clears routine activity automatically and surfaces only exceptions for review. Reporting packages are generated from governed data. Note that you’re not stepping away from treasury. You’re still setting assumptions, defining thresholds, and reviewing outputs. But now the system handles the repetitive work that used to absorb your team’s time. Your effort shifts to decisions, exceptions, and risk. That’s what maturity looks like in a PE-backed company: not more dashboards, but less reliance on manual effort in the workflows your sponsors and lenders depend on.

Where most PE-backed companies are vs. where they should be

Most PE-backed companies stay in Level 1 or Level 2 longer than they should because the process still appears workable. You can get the package out, so it feels like things are holding. That illusion breaks when liquidity tightens, or reporting demands increase. At that point, the issue isn’t output – it’s whether the process behind it can keep up. The transition is straightforward. First, connect the workflows, then reduce how much of the process still depends on manual work. Most Nilus customers move from Level 1 to Level 4 in under 90 days. Start your assessment, or read more on Treasury Readiness Quiz: Is Your Treasury Team Prepared for the Future?

Common PE treasury mistakes (and how to avoid them)

Covenant monitoring only at quarter-end

If you wait until quarter-end to run the covenant ratio, you’ve already lost time you may need to respond. By then, options are limited and any fix has to be made within the reporting window. The better approach is to monitor headroom throughout the quarter using lender definitions. That gives you time to see movement early and act before results are locked in.

Using accounting EBITDA instead of lender-defined EBITDA

The EBITDA used for management reporting rarely matches what the lender tests. Add-backs, pro forma adjustments, and definition differences can materially change the ratio. The fix is to build your covenant model directly from the credit agreement and update it alongside your operating data. Otherwise, headroom will appear stronger than it is.

Building the TWCF in isolation

A TWCF built only by finance tends to look clean on paper, but doesn’t reflect how cash actually moves. That’s because timing sits with different teams. Collections timing sits with sales and AR. Payment timing sits with AP. Payroll sits with HR or payroll ops. When those inputs don’t come in directly, you’re filling the gaps with assumptions. The forecast gets stronger when finance owns the model and operating teams provide the timing inputs.

Not consolidating cash across entities

This is a common way value leaks in a roll-up. You’re looking at total cash, but one entity is sitting on excess while another is borrowing to fund operations. It comes down to where cash sits, whether you can move, and whether one part of the business is borrowing while another sits idle. If $1 million is unused in one entity while another borrows at 8%, that’s about $80,000 a year in avoidable interest. To avoid that, you need a daily view of cash by entity and account, with clear visibility into restrictions and movement. That’s what allows you to reduce unnecessary borrowing.

Treating sponsor reporting as a chore, not a trust-builder

When you treat reporting as a separate task each cycle, the numbers stop matching across cash, forecast, and covenant views. To fix that, standardize the package. Use the same structure each time, keep a clear cash bridge, and prepare support schedules the same way every cycle so the numbers carry through.

How to build a PE-grade treasury operation in 90 days

Many PE-backed companies try to improve reporting before fixing the workflows underneath it. That gives you a cleaner package without improving how treasury runs.  The fastest way to improve treasury is to fix the workflows in the order they depend on one another. Start with cash visibility, then build the 13-week cash flow forecast, then layer in covenant monitoring, reconciliation, and finally reporting. Each phase makes the next one more reliable. Here’s a 90-day plan to build a PE-grade treasury operation:__wf_reserved_inherit
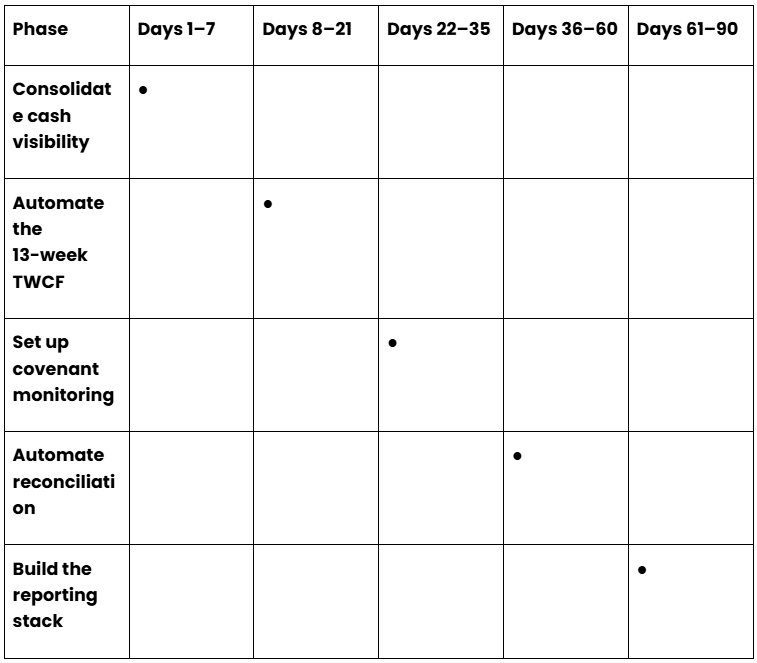
Days 1–7: Consolidate cash visibility

In the first week, focus on building a same-day cash position you can trust. Connect every bank account into one platform and confirm the account list is complete before using the output. Missing smaller or legacy accounts is the most common failure here – and it directly affects the answer you give. By day 7, if someone asks where liquidity stands today, you should be able to answer without pulling bank portals, consolidating balances manually, or following up later.

Days 8–21: Automate the 13-week TWCF

This is where you move from reporting cash to managing it. Connect the inputs that drive near-term liquidity: AR, AP, payroll, debt service, rent, taxes, and known one-off items. Assign clear owners for each assumption. You should own the forecast structure and weekly variance review, while collections, payments, and payroll should come from the teams closest to them. Don’t confuse data access with automation. Pulling ERP balances into a dashboard doesn’t give you a usable TWCF. The forecast only becomes credible when it reflects real timing, updates with actuals each week, and explains movement without rebuilds.

Days 22–35: Set up covenant monitoring

Pull every active covenant from each credit agreement into a controlled model. Use the actual lender definitions, testing dates, add-backs, pro forma adjustments, cure provisions, and reporting deadlines.  Remember, internal EBITDA and lender-defined EBITDA aren’t the same. If you track covenant position off the wrong definition, headroom will look stronger than it is. Once that logic is built into the model, set alert thresholds to monitor headroom continuously.

Days 36–60: Automate reconciliation

This is where you start getting time back. Once your bank and ERP feeds are connected, start with the highest-volume transaction categories: customer receipts, payroll, vendor payments, debt service, and standard intercompany activity. Leave edge cases for later.  Also, build matching rules that clear routine activity and surface exceptions quickly. If match rates stay low, fix the inputs – mapping, reference fields, or transaction categories that are still inconsistent.

Days 61–90: Build the reporting stack

Now turn treasury into a repeatable reporting process. Use a consistent weekly sponsor package. It should include a 13-week forecast view, cash bridge, commentary on material movement, and a short liquidity or covenant update when needed. Then carry that same logic into monthly cash reporting and quarterly lender support. Also, keep all reporting support in one place – covenant definitions, past forecast versions, supporting schedules, source files, and templates.  By day 90, your team should not be pulling from scattered files or rebuilding context each time.

What should be different by day 90

If the plan is working, you’ll feel the difference in how private equity treasury operations run. The process should feel materially less reactive. Cash visibility no longer depends on portal work. Your TWCF is easier to update and defend. Covenant movement surfaces earlier, and close stops absorbing routine reconciliation work.

What to look for in treasury software for PE-backed companies

When evaluating the best treasury software for private equity, features aren’t the differentiator. Every system shows cash, forecasts, and reports. What matters is whether it removes manual dependency from the workflows your team relies on. That shows up in how the system performs day-to-day:

1. Fast deployment with usable output early

You need a working cash position and a usable 13-week forecast within weeks. If implementation runs long, your team stays in spreadsheets while reporting pressure increases. Bank data should flow in directly, and the forecast should run on a pre-built structure from day one.

2. Operable by finance without IT dependency

When payment timing changes or a new entity is added, your team should be able to update logic and maintain integrations themselves. If changes require support, they get delayed or handled outside the system – and that’s when numbers stop lining up across reports.

3. Native covenant monitoring using lender definitions

Covenant tracking should sit inside the same model your team uses every day. When it’s separate, headroom gets checked too late. EBITDA definitions, add-backs, and adjustments should follow lender terms and update automatically as inputs change.

4. A 13-week forecast that reflects timing, not just balances

The system should be able to maintain the forecast without requiring finance to rebuild timing assumptions every week. Actuals should feed back automatically, and changes in AR, AP, payroll, or scheduled cash events should flow through without manual adjustment. When numbers shift, you should see what changed and why.

5. Built-in multi-entity consolidation

Your cash position should be consolidated across entities and accounts by default. If consolidation depends on exports or manual alignment, you’re working with a delayed view. You should be able to move between entity-level detail and a consolidated position without breaking either.

6. Execution built into the workflow

The workflow shouldn’t stall when a data feed is late or an input is missing. The system should surface the gap, continue processing what’s available, and isolate exceptions. Routine matching and updates should run automatically so your team can focus on exceptions, not maintenance.

7. Pricing aligned with a PE-backed operating model

The system should reduce ongoing manual work, not add implementation overhead or require dedicated resources to maintain. If it takes months to stabilize or requires constant support, it doesn’t fit a PE-backed operating model.

Frequently Asked Questions About PE Treasury Management

What is treasury management for PE-backed companies?

Treasury management in a PE-backed company is how you manage cash, debt, and reporting to meet sponsor and lender expectations. That involves maintaining a current view of cash across entities, running a 13-week forecast you can stand behind, and tracking covenant headroom before it tightens. If any part of that depends on delayed or manual processes, issues tend to surface in sponsor discussions or covenant reporting. With leverage in the structure, those issues escalate quickly. A delay in cash, a miss in the forecast, or a mismatch in reporting carries through to borrowing and covenant position – and you’re expected to explain it immediately.

What treasury software is best for PE-backed companies?

The best treasury software for PE-backed companies is the one that reduces manual work in the core workflows – cash visibility, forecasting, covenant tracking, and reporting – while remaining operable by a lean finance team. Enterprise tools like Kyriba and GTreasury are built for larger teams and longer timelines. In a PE-backed environment, that usually means over-implementation and slow adoption. Purpose-built platforms like Nilus are designed to hold up better because they match how the function actually operates.

How do PE sponsors monitor portfolio company cash?

Through the weekly 13-week cash flow forecast. That’s the core operating rhythm. Each week, you’re expected to walk through what changed, what’s coming, and where pressure is building. Sponsors focus on movement: receipts vs. plan, timing of outflows, revolver usage, and covenant headroom. The numbers matter, but consistency matters more. If your forecast shifts and you can’t explain why, that gets noticed quickly. Learn how to automate your cash flow forecast.

What are the biggest treasury challenges for PE-backed CFOs?

The biggest treasury challenges for PE-backed CFOs are managing cash across entities, keeping forecasts aligned with real timing, and staying ahead of covenant positions under leverage. As complexity increases, small gaps in visibility or timing compound quickly, especially when the process still relies on manual consolidation.

What is the 13-week cash flow forecast for PE companies?

The 13-week cash flow forecast (TWCF) is a rolling weekly projection of expected cash inflows and outflows over the next 90 days. It’s used to track liquidity, explain movement, and anticipate pressure before quarter-end.

How often should a PE-backed company report to its sponsor?

Most PE-backed companies report weekly on cash, monthly on financials, and quarterly for covenant compliance. This cadence gives sponsors a consistent view of liquidity and performance. If reporting only happens at month-end, issues tend to surface late, especially around liquidity and covenants. This ties directly to how covenant compliance is monitored.

Also Read

Join our Treasury Community

Treasury Masterminds is a community of professionals working in treasury management or those interested in learning more about various topics related to treasury management, including cash management, foreign exchange management, and payments. To register and connect with Treasury professionals, click the button below.


Check our other blogs

This article is written by our partner, Nilus

Cash flow forecasting in treasury fails structurally, not occasionally. Here are the 5 root causes, what driver-based AI forecasting actually does, and what a 30% accuracy improvement is worth in dollar terms.

Cash flow forecasting is the process of predicting a company’s cash inflows and outflows over a defined horizon – typically 13 weeks (short-term operational) or 12 months (strategic planning). Accurate forecasting requires integrating data from A/R, A/P, payroll, FX, and banking sources – and knowing which inputs are most likely to shift.

Here’s an uncomfortable truth most treasury professionals already know: the forecast is wrong. Not occasionally. Structurally, predictably, every single week. The question isn’t whether it’s wrong – it’s whether you can explain why it’s wrong before someone else points it out.

In 2026, that question has become significantly more consequential. Rising interest rates mean idle cash carries a real opportunity cost. PE sponsors and senior lenders require covenant-compliant forecasts as a contractual obligation, not a best-practice exercise. And boards – having watched CFOs get blindsided by cash crunches in 2022 and 2023 – are holding finance leaders accountable not just for forecast direction, but for forecast variance. “We were directionally right” doesn’t land the same way it used to.

This piece is an honest attempt to explain why forecasting fails, what driver-based AI forecasting actually does (as opposed to the breathless marketing claims you’ve already dismissed), and what a 30% improvement in accuracy is actually worth in dollar terms. No crystal balls. No transformation promises. Just the math.

  • 30%+ – Average forecast accuracy improvement for Nilus customers
  • 4-8 hrs – Typical weekly time to build a manual 13-week forecast
  • <30 min – Exceptions-only review time with AI-native forecasting
  • $5.5M – Stagnant cash identified and optimized at Optibus

What Is a 13-Week Cash Flow Forecast?

The 13-week cash flow forecast is the workhorse of treasury operations – and one of the most misunderstood documents in finance. Let’s be precise about what it actually is, because the details matter for everything that follows.

The 13-week horizon isn’t arbitrary. It spans exactly one fiscal quarter – short enough that the inputs are grounded in real transaction data (not budget assumptions), and long enough to support covenant monitoring, revolver management, and operational liquidity planning. If you’re running tighter, you can’t see around corners. If you’re running longer, you’re kidding yourself about the precision.

A complete 13-week forecast includes:

  • Beginning cash balance – your actual bank positions at the start of the period
  • Operating inflows – customer collections, primarily driven by A/R aging and historical payment behavior
  • Operating outflows – payroll, vendor payments (A/P), rent, and other recurring operating costs
  • Investing activity – capex, asset sales, and similar non-operating cash movements
  • Financing activity – debt service, draws or repayments on revolving credit facilities, equity transactions

One thing that trips people up: the 13-week forecast uses the direct method – it models actual cash transactions, not accounting income. FP&A typically builds their forecasts using the indirect method, starting from net income and adjusting for non-cash items.

These two methods answer different questions. Treasury needs to know when cash actually moves; FP&A needs to know what the P&L looks like. Translating between them is one of the most friction-generating handoffs in corporate finance – and a root cause of forecast error we’ll return to shortly.

When is a 13-week forecast required?

Always, ideally. But contractually, it’s typically required in three scenarios: PE portfolio company covenant packages (weekly submission is standard), revolving credit facility compliance monitoring, and IPO readiness (SOX preparation requires demonstrable financial controls, and a documented weekly cash forecasting process is part of that).

The 13-week forecast connects to the 12-month rolling forecast – the strategic layer used for board reporting, M&A planning, and long-range liquidity modeling. Best practice is to run both, integrated, so actual weekly cash signals continuously inform the strategic model. Most mid-market companies only have one or the other. That’s a gap worth closing.

Why Cash Flow Forecasts Are Always Wrong – 5 Root Causes

Here’s the thing: your forecaster is probably quite good at their job. The forecast is wrong because of architecture, not ability. Here are the five structural reasons it keeps happening:

  • A/R timing is guesswork. Collections are the single largest variable in any cash forecast, and they’re also the hardest to pin down. A/R teams provide their “expected” payment dates – but actual payment timing is driven by customer behavior: payment terms, relationship dynamics, invoice age, and whether accounts payable at the other end is running smoothly. Most companies have no systematic way to model collection timing based on historical payment patterns at the customer or invoice level. So they guess, optimistically, and variance accumulates.
  • A/P data is stale by the time it arrives. By the time A/P has processed an invoice and it enters the forecast, the cash impact has often already shifted. An unexpected early payment approval or a late vendor authorization is invisible to treasury until it clears the bank. The forecast says one thing; the bank says another. Post-mortem ensues.
  • FP&A and treasury speak different languages. FP&A builds revenue forecasts in accrual terms. Treasury needs cash-basis timing. Translating between them requires manual conversion, and the conversion is always lagging. FP&A’s numbers are typically three weeks old by the time they reach treasury, because they’re on a monthly close cycle. Treasury is trying to forecast this week’s collections using inputs that haven’t been updated since last month.
  • FX moves faster than spreadsheets. For companies with multi-currency operations, FX exposure is a continuous source of forecast error. A 2% move on a €20M receivable generates $400K in cash variance. Most Excel-based forecasting processes update FX rates once a week, at best. By then, the rate you used for last week’s forecast is already stale.
  • Inputs are collected manually. Email threads. Spreadsheet attachments. Slack messages asking A/P for their payment run. Every manual handoff is a delay, and every delay means the forecast is built on data that reflects last week’s reality, not today’s. By the time the forecast is assembled and formatted for distribution, half the inputs have already moved.

The bottom line

The problem isn’t the forecaster. It’s the architecture. A skilled treasury analyst running a manually-collected, weekly-batch forecasting process is operating at a structural disadvantage – not because of skill gaps, but because the data pipeline they’re working with was designed for a world that no longer exists.

Traditional Forecasting vs. AI-Native Forecasting

Let’s put the comparison on paper, because the differences aren’t cosmetic.

DimensionExcel / ManualAI-Native (Nilus)
Data freshnessWeekly batchReal-time, continuous
A/R input sourceManual submission from A/R teamAutomated from ERP + bank data
FX rate updatesWeekly manual refreshLive market rates
Forecast horizon13-week only (usually)13-week rolling + 12-month integrated
Variance explanationManual post-mortem (if it happens)Automated driver attribution
Accuracy vs. baselineBaseline30%+ average improvement
Build time per week4-8 hours<30 minutes (exceptions-based review)
Board-readinessManually formatted and summarizedAuto-generated board summary
Audit trailNone – spreadsheet history is not an audit trailFull input lineage and approval timestamps
Multi-entity / multi-currencyPainful consolidationNative support

The column that matters most to most CFOs: variance explanation. Not because they can’t do a post-mortem manually – they can – but because the post-mortem happens after the board meeting, not before it. Driver attribution turns that sequence around. You walk into the room already knowing why the forecast changed. That’s a different conversation.

What Driver-Based Forecasting Actually Means

If you’ve made it this far and you’re still skeptical about AI forecasting claims, good. That skepticism is well-earned – the space has been oversold relentlessly. So let’s be very specific about what driver-based forecasting does and doesn’t do.

It does not predict the future. No system does. Your customers’ payment behavior is influenced by factors no model will ever fully capture.

What it does do is systematically identify which inputs changed and quantify their impact on the forecast. That’s the entirety of the value proposition – and it turns out that’s worth a great deal.

Driver Attribution: A Concrete Example

Traditional forecasting tells you: “The week 6 cash position forecast is down $2.1M versus last week.”

Driver-based forecasting tells you: “The week 6 position is down $2.1M. Here’s why: three enterprise A/R invoices totaling $1.4M have shifted 10 days right based on updated payment timing from your ERP. GBP depreciated 1.8% against your hedged position, generating a $390K FX variance. One new A/P outflow of $310K was approved and added to the schedule this morning.”

The number is the same. But the second version tells you which levers to pull – call the three enterprise accounts, review your GBP hedge ratio, confirm the A/P approval is correct. You’re managing drivers, not outcomes.

Confidence Scores and Ranges

A well-designed AI forecasting system doesn’t just output a number – it outputs a range and a confidence level for each input driver, based on the historical accuracy of that driver across comparable periods.

A customer that has paid within 3 days of terms for 24 consecutive months gets a different confidence weight than a customer with erratic payment history. The aggregate forecast inherits those confidence levels, which means you know where the uncertainty lives before it becomes variance.

What This Means for the CFO

You can walk into the board meeting and explain variance before you’re asked. The forecast is defensible, not just directional. When a board member asks “why was cash $3M lower than forecast last month,” you have a prepared, data-backed answer – not a post-hoc rationalization constructed at midnight before the meeting.

The core framing

This is not a black box. The AI surfaces the math. The CFO makes the call. A forecast that shows its reasoning isn’t just more accurate – it’s categorically more useful than one that only tells you what it predicts.

Proof Points

This is where we put the numbers on the table. Across Nilus customers, the average improvement in cash flow forecast accuracy is 30%+. That’s not a projected improvement from a vendor model – it’s measured against each customer’s pre-implementation baseline.

At StackAdapt, 95% of transaction auto-tagging now feeds directly into forecast inputs, eliminating the manual categorization step and saving more than 30 hours of treasury analyst time per month.

At Optibus, automated real-time cash visibility surfaced $5.5M in stagnant cash that had been sitting in suboptimal positions – undetected by the prior manual process – and enabled its redeployment.

Time saved is meaningful. But the bigger return is the variance reduction. A 30% improvement in forecast accuracy doesn’t sound like much until you do the math on what a cash forecast miss actually costs.

What changed in your last forecast? See the drivers – not just the delta. Ask Nilus →

The 13-Week Forecast vs. 12-Month Rolling Forecast – When to Use Each

These two forecasting tools answer different questions and serve different audiences. Conflating them is a common source of organizational friction – and running only one when you need both is a gap that creates blind spots in both directions.

13-Week Cash Forecast12-Month Rolling Forecast
PurposeOperational liquidity managementStrategic planning, covenant monitoring
FrequencyWeekly refreshMonthly refresh
Input basisDirect cash transactionsActuals + budget assumptions
Primary userTreasurer, Cash ManagerCFO, FP&A
When criticalCovenant compliance, tight liquidity, revolver managementBoard reporting, M&A planning, IPO prep
AI advantageReal-time transaction data, automated driver attribution, instant refreshScenario modeling, sensitivity analysis, variance attribution across longer horizon

The integration gap

Most mid-market finance teams run only one of these – typically the 13-week, because it’s required. What they’re missing is the feedback loop: weekly actuals that continuously re-anchor the 12-month model, so the strategic forecast doesn’t drift from operational reality. Nilus supports both, integrated – the 13-week feeds the 12-month automatically.

Cash Forecasting for PE-Backed Companies – Higher Stakes, Less Margin for Error

If you’re a CFO at a PE-backed company, you already know that “best practice” is not the right frame for cash forecasting. It’s a contractual obligation with financial penalties attached.

PE sponsors typically require weekly 13-week cash forecasts as a condition of the credit agreement – submitted to the sponsor, and sometimes to the senior lender, by end of business Monday. The forecast is covenant evidence. It’s not a management tool; it’s a legal document.

Debt covenants – leverage ratio, interest coverage, minimum liquidity threshold – are triggered by actual cash positions.

But the point of the forecast is to see trouble coming 4 to 8 weeks ahead, not the week it hits. That’s the early warning system that keeps treasury out of a technical default conversation.

The consequences of getting it wrong aren’t academic. A covenant breach triggers fee clauses, accelerated lender scrutiny, potential cross-default provisions, and in some structures, acceleration of the debt. Even a near-miss – where treasury identified the risk late and had to scramble – damages the CFO’s credibility with the sponsor in ways that are hard to recover.

Nilus builds a covenant tracking layer directly on top of the cash forecast – automatically flagging when projected cash positions approach threshold levels, so treasury has 4-6 weeks of runway to take corrective action before a breach becomes visible.

That’s not a nice-to-have for PE-backed companies. That’s table stakes. Learn more about how this fits into a broader treasury management system.

How to Evaluate Cash Flow Forecasting Software – 6 Questions to Ask

The market for cash forecasting software is crowded, and the demos are polished. Here’s how to cut through the noise and ask the questions that actually differentiate systems. (Spoiler: competitors like Kyriba and Trovata have very different answers to some of these)

  • Does the system ingest live A/R and A/P data from your ERP, or does someone still have to feed it inputs? This is the foundational question. If the answer involves a weekly export, a CSV upload, or an email to A/R, the system has not solved the root cause of forecast error – it has just digitized the manual process.
  • Does it support both the 13-week direct method and 12-month rolling forecasts? Many tools do one well and the other poorly. If you need both integrated – and you do – confirm the integration is native, not a workaround.
  • When the forecast changes, does the system tell you why? Which drivers moved, by how much, and in which direction? If the answer is “you can run a variance report,” that’s not driver attribution – that’s a spreadsheet with better formatting. See the section on driver-based forecasting above for what this should actually look like.
  • Does it support multi-currency and multi-entity consolidation natively? If you have 10+ entities or operate in 3+ currencies, the consolidation step is where most tools fall apart. Ask to see a live demo of a multi-entity consolidation. Watch how long it takes. That’s your answer.
  • Can it model scenarios? Specifically: “What happens to our 13-week cash position if our top 3 customers pay 15 days late?” This is the question treasury asks most frequently when things get uncertain. If scenario modeling requires a separate tool or manual manipulation, the workflow breaks under pressure – which is exactly when you need it most.
  • What is the audit trail on the forecast? Can you show an auditor, a PE sponsor, or a lender exactly what inputs were used, when they were ingested, who approved the forecast, and what changed between versions? If the answer is “we have version history in SharePoint,” that’s not an audit trail – that’s a prayer. Full input lineage is a requirement for PE-backed companies and a strong expectation for anyone preparing for an IPO or reconciliation automation at scale.

Also Read

Join our Treasury Community

Treasury Masterminds is a community of professionals working in treasury management or those interested in learning more about various topics related to treasury management, including cash management, foreign exchange management, and payments. To register and connect with Treasury professionals, click the button below.

This article is written by Palm

Categorisation is one of the oldest jobs in treasury. Tag every transaction so the data downstream actually means something: forecasts, Variance Analysis, Cash Positioning, board reporting. For years, treasurers have done it one of two ways: by hand, or with rules. AI is replacing both.

The interesting argument isn’t AI vs manual. Most teams gave up on tagging thousands of transactions a week by hand long ago. The real argument is AI vs rules, because rules are what most TMSs and Excel-based processes still run on. That’s the layer AI is taking out.

Why rules-based transaction categorisation breaks down

Rules look elegant on paper. If the counterparty contains “HSBC” and the amount is negative, tag it as a bank charge. If the description starts with “PAYROLL”, tag it as payroll. Easy.

Reality is messier. Counterparty names change when a vendor rebrands. Payment descriptions get truncated by the bank. A new entity is acquired and starts paying into the same account with a different reference format. A subsidiary in another country sends a tax payment no rule has ever seen. Each of those breaks the rule silently. The transaction either falls into “Uncategorised,” or gets miscategorised and quietly distorts the forecast.

Then there is the maintenance burden. Every new counterparty needs a rule. Every edge case needs an exception. The person who built the engine left two years ago, and nobody is sure which rules are still in use. The library grows, contradictions multiply, and the rules never quite catch up with how the business actually moves money.

Rules work on the world you’ve already seen. They collapse on the one you haven’t.

How AI transaction categorisation works

AI categorisation is pattern recognition with feedback.

The model trains on your historical transactions and the categories a human assigned to each one. It learns the signals that distinguish a customer payment from an intercompany transfer, a one-off bonus from a payroll run, a tax settlement from a supplier payment. Not just the counterparty name, but the amount, the description, the account pair, the currency, the timing, all weighed together.

When a new transaction lands, the model doesn’t ask “does this match any rule?” It asks “which pattern does this look most like?” and outputs a category with a confidence score. Above the threshold, it tags automatically. Below it, the transaction goes to a treasurer for review. Their decision feeds back into the model.

That feedback loop is the key difference. Rules don’t learn. AI does. Every correction makes the next prediction sharper. New counterparties get classified the moment they appear. Description changes don’t break anything. The model handles ambiguity because it doesn’t need an exact match.

What AI categorisation can do that rules can’t

Rules need explicit logic. AI captures patterns you’d never think to encode: that a particular customer always pays on the 27th, that a supplier’s invoices come in two amount bands, that a certain intercompany flow only happens at quarter-end. Those signals improve accuracy in ways no rule library could.

And rules don’t scale across entities. AI does. One model categorises transactions across every subsidiary, in every currency, with consistent logic.

How treasurers stay in control with AI categorisation

The fear with AI is the black box. A good system isn’t one. Every prediction comes with a confidence score and a visible reason. The treasurer can override any tag, and the model learns from that override. Transactions can be marked as System Outliers so they don’t pollute future training. The taxonomy can be set at any level of hierarchy: entity, account, subsidiary.

You keep the control rules gave you. You lose the maintenance burden.

AI vs rules-based categorisation: the bottom line

Rules-based categorisation was a step forward thirty years ago. It is now the bottleneck: the library nobody owns, the edge cases nobody covered, the silent miscategorisations nobody catches until the forecast misses.

AI categorisation handles the messy reality of real treasury data, learns from every correction, and stays accurate as the business changes. It isn’t a faster rules engine. It’s what rules engines were trying to become.

Also Read

Join our Treasury Community

Treasury Masterminds is a community of professionals working in treasury management or those interested in learning more about various topics related to treasury management, including cash management, foreign exchange management, and payments. To register and connect with Treasury professionals, click the button below.

This article is written by Trustpair

Imagine discovering that one of your trusted employees had spent years editing real supplier invoices to redirect payments into their own account. That’s exactly what happened at Miami University, which lost over $2.3 million to an internal fraudster. Vendor fraud is a severe and growing threat to UK businesses. The Home Office estimates fraud cost UK businesses £5.2 billion in the year ending March 2024, while fake invoice fraud alone affected 11% of UK businesses in the same period.

In this article, learn the most common types of vendor fraud and how to fight against it with Trustpair.

Key Takeaways

  • Vendor fraud refers to schemes in which fraudsters impersonate or compromise real suppliers to divert business payments.
  • The three most common vendor fraud schemes are: phishing/BEC attacks, internal employee fraud, and invoice fraud through compromised supplier accounts.
  • Fraud is now the UK’s most prevalent crime type, accounting for 45% of all crime in England and Wales (year ending September 2025). The total economic and social cost reached £14.4 billion in 2023–2024 (Home Office Fraud Strategy 2026–2029).
  • 1 in 4 UK businesses (27%) experienced fraud in the last 12 months; fake invoice fraud affected 11% and mandate fraud 7% (Economic Crime Survey 2024).
  • Payment rails commonly targeted in the UK include Faster Payments, BACS, and CHAPS, all of which can be exploited through fraudulent bank detail changes.
  • The UK’s APP fraud reimbursement rules (in force October 2024) place greater scrutiny on corporate payment controls and require businesses to demonstrate pre-payment due diligence.
  • The most effective defence is automated vendor account validation before every payment.
  • Trustpair has blocked 100% of payment fraud attempts for its customers since deployment.

What is phishing and Business Email Compromise (BEC) in vendor fraud?

Phishing emails involve the impersonation of a genuine third party in order to gain access to sensitive information or divert a payment. In the vendor fraud context, this is often called Business Email Compromise (BEC) or Vendor Email Compromise (VEC).

There are different levels of sophistication. Spear phishing involves detailed prior research: fraudsters identify the payment approver’s name, the company’s standard invoicing process, and the real vendor’s email format, often spoofing it convincingly. Busy procurement teams are unlikely to spot the difference.

Pharming goes further, directing victims to malicious websites designed to harvest employee login credentials and gain access to confidential company systems.

A significant and growing threat is AI-enhanced phishing. According to Abnormal Security’s 2026 Attack Landscape Report, 63% of organisations report an increase in email attacks using AI-generated content — text with no spelling errors, accurate tone, and contextually appropriate personalisation. In controlled testing, AI-generated phishing emails achieve a 14% click rate, nearly double the 8% rate for human-crafted attacks.

BEC attacks rose 38% year-over-year in 2025, with Vendor Email Compromise (VEC) — where fraudsters operate from inside a compromised supplier account — growing 67% in the same period (Abnormal Security).

These attacks rely on social engineering tactics. A typical scenario: fraudsters impersonate a known supplier mid-contract and submit a convincing invoice for legitimate-sounding services. Because the supplier relationship exists and no automated verification is in place, the payment goes through unchallenged.

Fraudsters frequently target payments made via Faster Payments and BACS, requesting account detail changes that re-route funds to mule accounts. Given the near-instant settlement of Faster Payments and the direct debit capabilities of BACS, funds can be irrecoverable within minutes. CHAPS payments for high-value transfers carry similar risk.

What is internal employee fraud and how does it work?

Internal fraud, also known as employee fraud, is another example of vendor fraud.

In this scheme, an employee exploits their access to submit and conceal fraudulent invoices. They may siphon payments to a shell company, inflate the price of goods or services, or redirect funds to an account they control. Because the employee understands exactly how invoices are normally processed, the fraud can remain invisible for extended periods.

With hundreds or thousands of suppliers in a typical organisation, accounts payable staff are unlikely to flag an invoice that looks and behaves like all the others.

The fraud triangle explains why employees commit fraud through three converging factors:

  1. Motivation: financial pressure from redundancy, debt, or perceived unfair treatment
  2. Opportunity: authorised access to payment systems or supplier master data
  3. Rationalisation: routing payments through a shell company makes them appear legitimate

One example of employee fraud at a British business illustrates this precisely. The financial controller, facing personal financial pressure after her partner became redundant, noticed an existing supplier had ceased trading. She edited a previous invoice, replaced the bank details with those of her own shell company, and deliberately kept each transaction below the co-authorisation threshold. The CFO, busy and trusting of a long-standing colleague, only scrutinised payments to new suppliers. The fraud went undetected, costing the business approximately £20,000.

Under the PSR’s APP fraud reimbursement rules, which came into force in October 2024, banks and payment service providers must reimburse victims of authorised push payment fraud up to £85,000. The PSR reported that in the first three months of the rules being in force, 86% of money stolen through in-scope APP fraud was returned to victims (UK Finance, Fraud Report 2025). While this applies primarily to personal accounts, it is increasing scrutiny on corporate payment controls and reinforcing the need for businesses to demonstrate pre-payment due diligence.

What is invoice fraud, and why is it so hard to detect?

Invoice fraud is a third attack vector. Here, the communication genuinely appears to come from a real supplier, because that supplier’s email or systems have been hacked.

The attacker, operating from inside the compromised supplier account, requests a change in bank account details. They may also submit invoices for goods or services never delivered. These attacks are particularly dangerous because businesses are far less suspicious of established supplier relationships, typically concentrating verification efforts on new vendors only.

According to the Home Office’s Economic Crime Survey 2024, mandate fraud — where fraudsters trick a business into changing bank details to divert payments — affected 7% of UK businesses in the preceding 12 months, while fake invoice fraud was the most common type of fraud, affecting 11% of all businesses.

Sade Telecom, an electrical network company, fell victim to this type of fraud before partnering with Trustpair. Their accounts payable team received a payment detail change request from what appeared to be an existing supplier. Without an automated verification system, they processed the change and sent subsequent payments to the fraudulent account. It was only when the genuine vendor issued a late-payment notice that the fraud was discovered.

Following the incident, Sade Telecom implemented Trustpair to automatically validate payment details before every transaction. The result: 100% of subsequent fraud attempts were blocked, with the solution live within 72 hours.

For UK organisations, mandate fraud most commonly targets BACS Direct Credit and Faster Payment instructions. Because Faster Payments settle in seconds, early detection before payment authorisation is the only reliable defence. Trustpair’s pre-payment validation integrates directly into your payment workflow to prevent fraud at source.

How can you prevent vendor fraud?

Vendor account validation is the most effective way to prevent all three types of vendor fraud and detect vendor fraud red flags before a payment is ever released.

The process involves cross-checking the details on a supplier invoice against international and domestic databases, verifying:

  1. Bank account details: account holder name, sort code, and account number
  2. Company identity: registered name, ultimate beneficial ownership, sanctions and watchlist screening

By automating this validation across every payment cycle, UK finance teams can confirm they are paying who they believe they are paying, not fraudsters who have intercepted the relationship.

Manual checks are slow, inconsistent, and easily circumvented. Automated vendor account validation removes human error and scales to match the size of your supplier base, whether you have 200 or 200,000 vendors.

In Summary

The three most common vendor fraud schemes are:

  • Phishing/BEC: fraudsters impersonate suppliers using social engineering and AI-generated communications to divert payments
  • Employee (internal) fraud: insiders create shell companies or manipulate existing invoices to siphon funds
  • Invoice fraud: real supplier accounts are compromised to request fraudulent payment detail changes

Protect your business by validating supplier accounts against verified databases in real time, before every payment. With Trustpair, you can demonstrate the due diligence required under current UK payment regulations while blocking 100% of fraud attempts.

Read More from Trustpair

Join our Treasury Community

Treasury Masterminds is a community of professionals working in treasury management or those interested in learning more about various topics related to treasury management, including cash management, foreign exchange management, and payments. To register and connect with Treasury professionals, click the button below.